UPSC Prelims 2018 · CSAT
Question 65: Data Interpretation
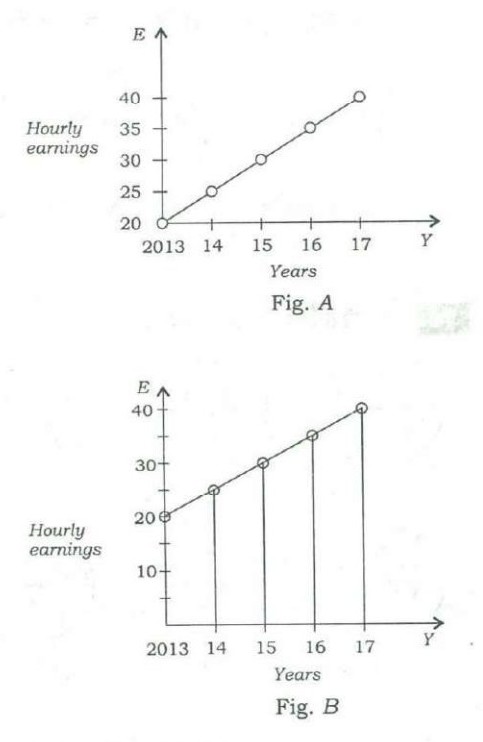
Average hourly earnings per year (E) of the workers in a firm are represented in figures A and B as follows :
From the figures, it is observed that the
AnswerUPSC’s answer is (c).
Both figures plot the same data: E rises from 20 in 2013 to 40 in 2017, by 5 each year. They only look different because Fig. A starts its vertical axis at 20 and Fig. B at 0. Since the numbers are identical, the values, the range (20 to 40) and the rate of increase (5 per year) are all the same, and so is the slope of each line. The visual difference comes from the scale of the axis, not from the data.
Why each option is right or wrong
- (a) Values are the same: 20, 25, 30, 35, 40 in both.
- (b) The range is 20 to 40 in both.
- (c) Correct: the same data gives the same slope; only the axis scale differs.
- (d) Earnings rise by 5 per year in both.
Answer: UPSC’s key. Explanation: written by UPSC Grade, not by UPSC.
Source: UPSC, Civil Services (Preliminary) Examination 2018, General Studies Paper II (CSAT), Series A. The paper on upsc.gov.in.