UPSC Prelims 2018 · CSAT
Question 64: Data Interpretation
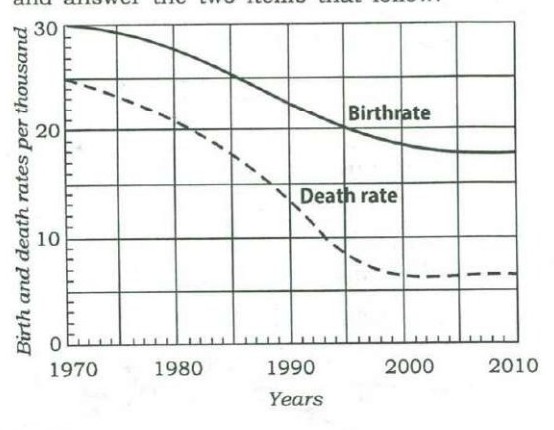
With reference to the above graph, consider the following statements considering 1970 as base year :
- 1.Population has stabilized after 35 years.
- 2.Population growth rate has stabilized after 35 years.
- 3.Death rate has fallen by 10% in the first 10 years.
- 4.Birthrate has stabilized after 35 years.
Which of the above are the most logical and rational statements that can be made from the above graph?
AnswerUPSC’s answer is (d).
Growth rate = birth rate - death rate. After about 2005 both curves are flat, so the gap, and the growth rate, is stable (statement 2), and so is the birth rate (statement 4). Population itself is not stable because births still exceed deaths, so it keeps growing (statement 1). The death rate fell from about 25 to about 21 per thousand in the first ten years, a fall of roughly 15%, not 10% (statement 3). So 2 and 4 hold.
- 1. Births still exceed deaths, so population keeps growing.
- 2. Both rates are flat after about 2005, so their gap is steady.
- 3. The fall from about 25 to 21 is roughly 15%, not 10%.
- 4. The birth rate levels off near 18 after about 2005.
How you could have got this
- If you were sure statement 1 is not correct, (a) and (b) go: each of them includes 1.
What you needed to know: Births still exceed deaths, so population keeps growing.
- Then, if you were sure statement 2 is correct, (c) goes: it leaves 2 out.
What you needed to know: Both rates are flat after about 2005, so their gap is steady.
Only (d) is left. You didn’t need statements 3 or 4.
Which options go is worked out from UPSC’s key and the options, not by a model.
Why each option is right or wrong
- (a) Statement 1 is false: births exceed deaths, so population still grows.
- (b) Includes statements 1 and 3, both of which are false.
- (c) Statement 3 is false: the death rate fell by roughly 15%, not 10%.
- (d) Correct: growth rate and birth rate both flatten after about 35 years.
Answer: UPSC’s key. Explanation: written by UPSC Grade, not by UPSC.
Source: UPSC, Civil Services (Preliminary) Examination 2018, General Studies Paper II (CSAT), Series A. The paper on upsc.gov.in.