UPSC Prelims 2018 · CSAT
Question 63: Data Interpretation
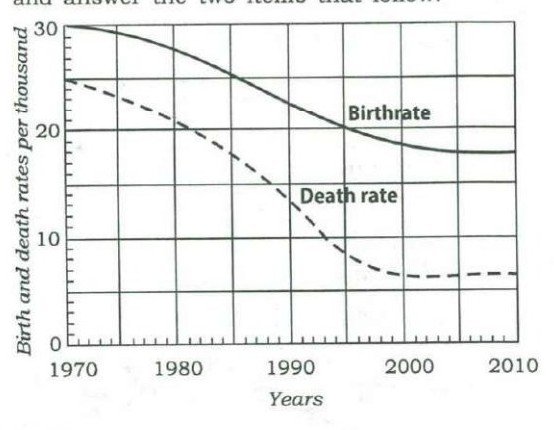
Consider the following graph in which the birthrate and death rate of a country are given, and answer the two items that follow.
Looking at the graph, it can be inferred that from 1990 to 2010
AnswerUPSC’s answer is (d).
Population growth rate is the birth rate minus the death rate, which is the gap between the two curves. The gap is about 9 per thousand in 1990, widens to about 12 around 2000, and narrows to about 11 by 2010. So the growth rate first rises and then eases, and does not follow one steady direction across 1990 to 2010. Read the gap, not either curve alone.
Why each option is right or wrong
- (a) The gap rises only until about 2000, then narrows slightly.
- (b) The gap is wider in 2000 than in 1990, so it does not fall throughout.
- (c) The gap changes, from about 9 to about 12 and then about 11, so it is not stable.
- (d) Correct: the growth rate rises and then eases, showing no single trend.
Worth knowing: The gap is wider in 2010 than in 1990, so 'increased' is arguable; UPSC's key treats the rise and later dip as no single trend.
Answer: UPSC’s key. Explanation: written by UPSC Grade, not by UPSC.
Source: UPSC, Civil Services (Preliminary) Examination 2018, General Studies Paper II (CSAT), Series A. The paper on upsc.gov.in.