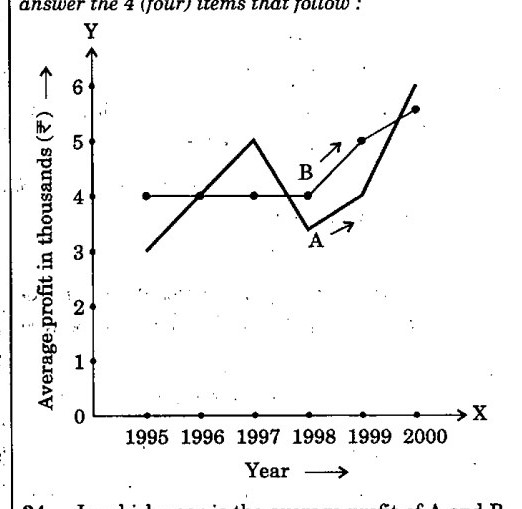
How much more average profit did A make in the year 2000 than in the year 1999 ?
a₹ 200
b₹ 1,000
c₹ 1,500
d₹ 2,000
AnswerUPSC’s answer is (d).
A's value in 1999 reads about 4 thousand rupees and in 2000 about 6 thousand. The difference is 6 - 4 = 2 thousand, which is 2,000 rupees. Reading the vertical axis in thousands, each grid step is 1,000, so a rise of two grid steps is 2,000. Check the unit before choosing an option.
Why each option is right or wrong
(a) 200 misreads the unit; the rise is two thousand.
(b) 1,000 is a rise of one grid step; the graph shows two.
(c) 1,500 is not what the readings give; A rises from about 4 to 6.
(d) Right. About 6,000 less about 4,000 is 2,000.
Answer: UPSC’s key. Explanation: written by UPSC Grade, not by UPSC.