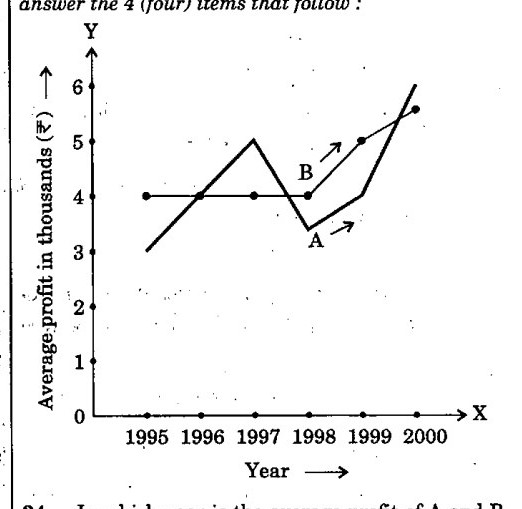
What is the difference between the average profit of B and A in the year 1998 ?
a- ₹ 100
b- ₹ 1,000
c+ ₹ 600
d- ₹ 300
AnswerUPSC’s answer is (c).
Read the 1998 values from the graph: B is about 4 thousand rupees and A about 3.4 thousand, because A has dipped after its 1997 peak. The difference, B minus A, is 4 - 3.4 = 0.6 thousand, which is +600 rupees. The sign matters: B is above A, so the difference is positive.
Why each option is right or wrong
(a) -100 would mean B is below A by 100, but B is higher.
(b) -1,000 has the wrong sign and the wrong size.
(c) Right. 4,000 - 3,400 = +600.
(d) -300 has the wrong sign and does not match the readings.
Answer: UPSC’s key. Explanation: written by UPSC Grade, not by UPSC.