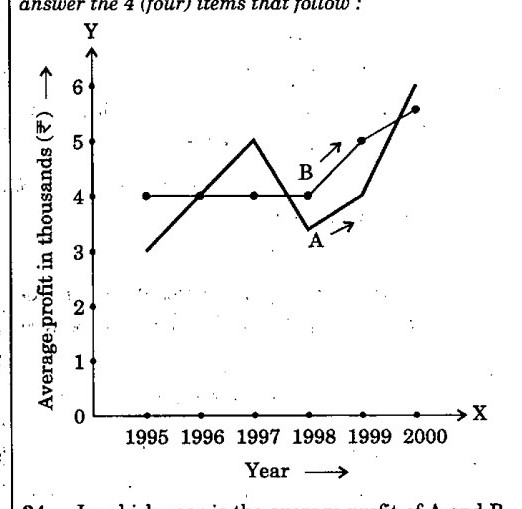
In which year is the average profit of A and B same ?
a1995
b1996
c1997
d1998
AnswerUPSC’s answer is (b).
Read the two lines off the graph. B is flat at about 4 thousand rupees from 1995 to 1998. A starts near 3 in 1995, reaches 4 in 1996, peaks near 5 in 1997, dips to about 3.4 in 1998, then rises. The two lines meet only where both are at 4, which is 1996. In 2000 they are close but not equal, with A near 6 and B near 5.6.
Why each option is right or wrong
(a) In 1995 A is about 3 and B about 4.
(b) Right. Both are at about 4 thousand in 1996.
(c) In 1997 A is about 5 against B's 4.
(d) In 1998 A is about 3.4 against B's 4.
Answer: UPSC’s key. Explanation: written by UPSC Grade, not by UPSC.