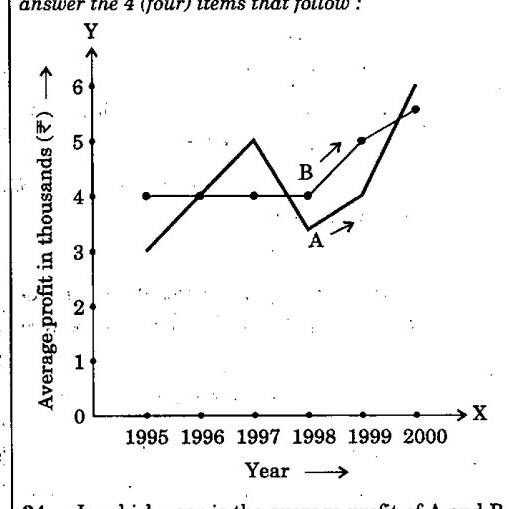
What is the trend of the average profit of B from the year 1997 to the year 2000 ?
aNon-increasing
bNon-decreasing
cSteady
dFluctuating
AnswerUPSC’s answer is (b).
Read B from the graph for 1997 to 2000: about 4, 4, 5 and a little above 5. It never falls, though it stays level between 1997 and 1998 before rising. A series that never falls is non-decreasing. It is not steady, since it ends higher, and it is neither non-increasing nor fluctuating, since it has no fall.
Why each option is right or wrong
(a) Non-increasing would need the values to stay level or fall, but B rises.
(b) Right. B stays level, then rises, and never falls.
(c) Steady would mean no change at all, but B rises after 1998.
(d) Fluctuating needs ups and downs; B has no fall.
Answer: UPSC’s key. Explanation: written by UPSC Grade, not by UPSC.