UPSC Prelims 2018 · CSAT
Question 73: Data Interpretation
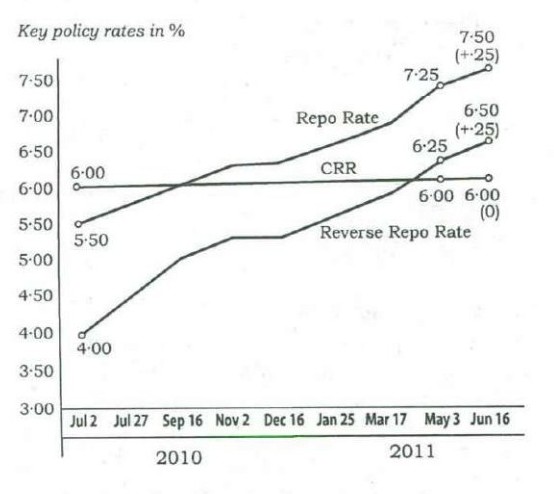
The graph given below indicates the changes in key policy rates made by the Central Bank several times in a year :
Which one of the following can be the most likely reason for the Central Bank for such an action?
AnswerUPSC’s answer is (d).
The graph shows the repo rate and the reverse repo rate being raised again and again over a year, from 5.5 to 7.5 and from 4.0 to 6.5, while the cash reserve ratio stays near 6. Raising policy rates makes borrowing costlier and drains liquidity, the standard way to cool demand and control rising prices. So the most likely reason is an anti-inflationary stance.
Why each option is right or wrong
- (a) Higher rates can attract capital, but that is not the aim of repeated hikes.
- (b) Rate rises reduce liquidity; raising it needs cuts.
- (c) Savings may rise as a side effect, but the sequence of hikes signals inflation control.
- (d) Correct: repeated rate increases are the usual tool against inflation.
Answer: UPSC’s key. Explanation: written by UPSC Grade, not by UPSC.
Source: UPSC, Civil Services (Preliminary) Examination 2018, General Studies Paper II (CSAT), Series A. The paper on upsc.gov.in.