UPSC Prelims 2018 · CSAT
Question 67: Data Interpretation
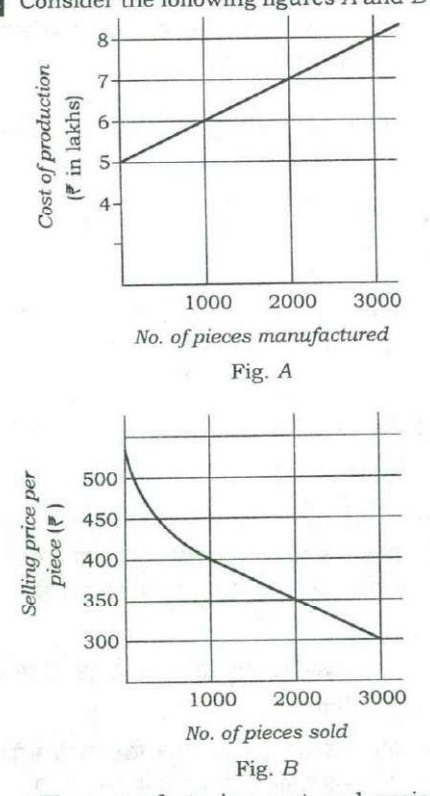
Consider the following figures A and B :
The manufacturing cost and projected sales for a product are shown in the above figures A and B respectively. What is the minimum number of pieces that should be manufactured to avoid a loss?
AnswerUPSC’s answer is (a).
Fig. A gives cost: ₹5 lakh fixed plus ₹1,000 per piece, so it is 6, 7 and 8 lakh at 1,000, 2,000 and 3,000 pieces. Fig. B gives the selling price per piece: ₹400, ₹350 and ₹300 at those quantities. Revenue = pieces × price: 4 lakh at 1,000 (below the 6 lakh cost, a loss), 7 lakh at 2,000 (equal to the 7 lakh cost, break-even), 9 lakh at 3,000 (above the 8 lakh cost, a profit). The smallest output without loss is 2,000 pieces.
Why each option is right or wrong
- (a) Correct: at 2,000 pieces, revenue and cost are both ₹7 lakh.
- (b) 2,500 pieces earns a profit, but 2,000 already breaks even.
- (c) 3,000 pieces earns a profit, but it is not the minimum.
- (d) 3,500 pieces is above the break-even point; it is not the minimum.
Answer: UPSC’s key. Explanation: written by UPSC Grade, not by UPSC.
Source: UPSC, Civil Services (Preliminary) Examination 2018, General Studies Paper II (CSAT), Series A. The paper on upsc.gov.in.