UPSC Prelims 2018 · CSAT
Question 12: Data Interpretation
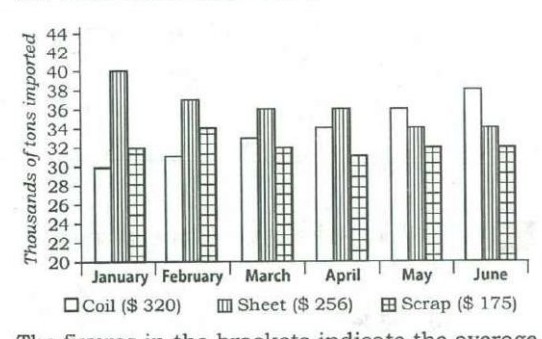
The following three items are based on the graph given below which shows imports of three different types of steel over a period of six months of a year. Study the graph and answer the three items that follow.
The figures in the brackets indicate the average cost per ton over six months period. What was the approximate total value (in $) of sheet steel imported over the six months period?
AnswerUPSC’s answer is (c).
Sheet steel imports over the six months, read from the graph, are 40, 37, 36, 36, 34 and 34 thousand tons, a total of 217 thousand tons. At $256 per ton the value is 217 × 256 = 55,552 thousand dollars, about 55,550 in the options. The option figures are in thousands of dollars, because tonnage is in thousands; read as plain dollars they would be a thousand times too small.
Why each option is right or wrong
- (a) 45,555 would match only about 178 thousand tons at $256.
- (b) 50,555 would match only about 197 thousand tons at $256.
- (c) Correct: 217 × 256 = 55,552, about 55,550.
- (d) 65,750 would need about 257 thousand tons, well above 217.
Answer: UPSC’s key. Explanation: written by UPSC Grade, not by UPSC.
Source: UPSC, Civil Services (Preliminary) Examination 2018, General Studies Paper II (CSAT), Series A. The paper on upsc.gov.in.