UPSC Prelims 2018 · CSAT
Question 11: Data Interpretation
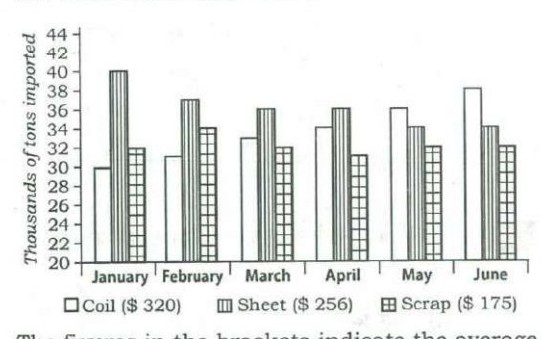
The following three items are based on the graph given below which shows imports of three different types of steel over a period of six months of a year. Study the graph and answer the three items that follow.
The figures in the brackets indicate the average cost per ton over six months period. By how much (measured in thousands of tons) did the import of sheet steel exceed the import of coil steel in the first three months of the year?
AnswerUPSC’s answer is (c).
Read the first three months from the graph. Sheet steel: 40, 37 and 36 thousand tons, a total of 113. Coil steel: 30, 31 and 33, a total of 94. Excess of sheet over coil = 113 - 94 = 19 thousand tons. Add each series separately before subtracting; that avoids month-by-month slips.
Why each option is right or wrong
- (a) 11 does not equal 113 - 94.
- (b) 15 does not equal 113 - 94.
- (c) Correct: 113 - 94 = 19 thousand tons.
- (d) 23 does not equal 113 - 94.
Answer: UPSC’s key. Explanation: written by UPSC Grade, not by UPSC.
Source: UPSC, Civil Services (Preliminary) Examination 2018, General Studies Paper II (CSAT), Series A. The paper on upsc.gov.in.