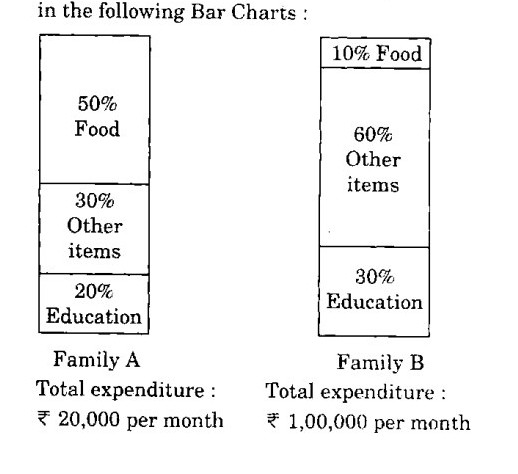
The proportion of expenditure on various items by two families A and B are represented in the following Bar Charts :
Family ATotal expenditure : ₹ 20,000 per month
Family BTotal expenditure : ₹ 1,00,000 per month
From these charts, we can conclude that
aFamily A spent more money on food than Family B.
bFamily B spent more money on food than Family A.
cFamily A and Family B spent the same amount on food.
dThe expenditure on food by Family A and Family B cannot be compared.
AnswerUPSC’s answer is (c).
Compute the actual money, not the percentages. Family A spends 50% of ₹20,000 = ₹10,000 on food. Family B spends 10% of ₹1,00,000 = ₹10,000 on food. The amounts are equal. Percentages of different totals cannot be compared directly; convert them to amounts first.
Why each option is right or wrong
(a) Wrong: A's food spending is ₹10,000, the same as B's.
(b) Wrong: B's food spending is ₹10,000, the same as A's.
(c) Right: 50% of 20,000 and 10% of 1,00,000 are both ₹10,000.
(d) Wrong: the totals are given, so the amounts can be found and compared.
Answer: UPSC’s key. Explanation: written by UPSC Grade, not by UPSC.