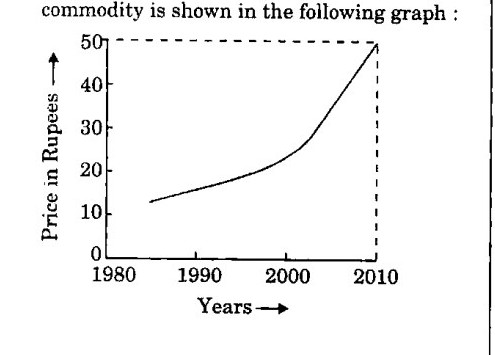
Year-wise variation of the price of a certain commodity is shown in the following graph :
The price of the commodity in the year 1990
amust have been ₹ 10/-
bmust have been ₹ 12/-
cmust have been anywhere between ₹ 10/- and ₹ 20/-
dis higher than that in the year 1991
AnswerUPSC’s answer is (c).
Read the graph at 1990. The price line starts at about ₹13 in the mid-1980s and rises steadily and gently, climbing sharply only near 2010. At 1990 it sits somewhere between ₹10 and ₹20, but the graph does not allow an exact value. The line is rising, so the price in 1990 is lower than in 1991, not higher. Only 'between ₹10 and ₹20' is certain.
Why each option is right or wrong
(a) Wrong: the exact value cannot be read, so 'must have been ₹10' cannot be justified.
(b) Wrong: the exact value cannot be read as ₹12.
(c) Right: the line at 1990 lies between 10 and 20 rupees.
(d) Wrong: the line rises, so the 1990 price is lower than the 1991 price.
Answer: UPSC’s key. Explanation: written by UPSC Grade, not by UPSC.