UPSC Prelims 2013 · CSAT
Question 47: Basic Numeracy
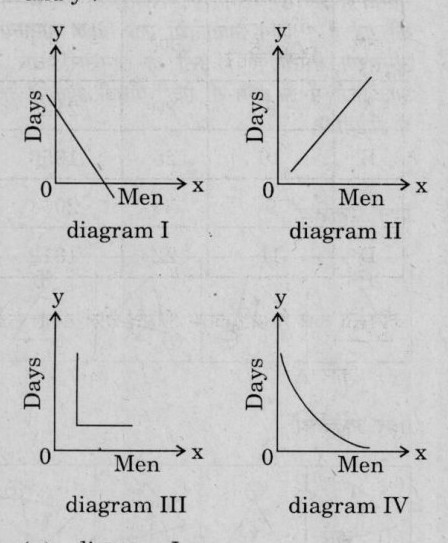
Consider the following diagrams : x men, working at constant speed, do a certain job in y days. Which one of these diagrams shows the relation between x and y ?
AnswerUPSC’s answer is (d).
If x men finish a job in y days at constant speed, the total work x times y is fixed, so y = k / x. More men means fewer days, but days never reach zero: the graph is a falling curve that approaches both axes (a rectangular hyperbola). That is diagram IV. A straight falling line would give zero days at a finite number of men; a rising line shows direct proportion; and an L-shape would mean extra men stop reducing days after a sharp drop.
Why each option is right or wrong
- (a) Wrong. A straight falling line reaches zero days at a finite number of men.
- (b) Wrong. A rising line means more men take more days, the opposite.
- (c) Wrong. An L-shape means days stop changing after a sudden drop; real inverse variation is smooth.
- (d) Right. Days fall along a smooth curve as men increase (x times y is constant).
Answer: UPSC’s key. Explanation: written by UPSC Grade, not by UPSC.
Source: UPSC, Civil Services (Preliminary) Examination 2013, General Studies Paper II (CSAT), Series A. The paper on upsc.gov.in.