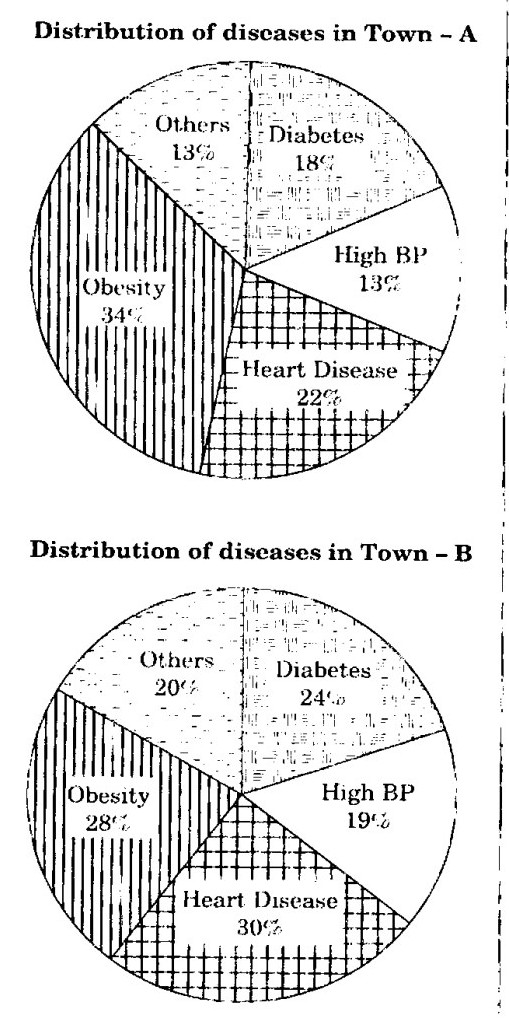
Directions for the following 2 (two) items : The following pie charts show the break up of disease categories recorded in the patients from two towns, Town A and Town B. Pie charts plot the disease categories as percentage of the total number of patients. Based on these, answer the two items that follow the charts. Which of the two towns has a higher number of persons with Diabetes ?
aTown A
bTown B
cSame in Town A and Town B
dNo inference can be drawn
We are checking the answer to this question, so none is shown yet.