UPSC Prelims 2011 · CSAT
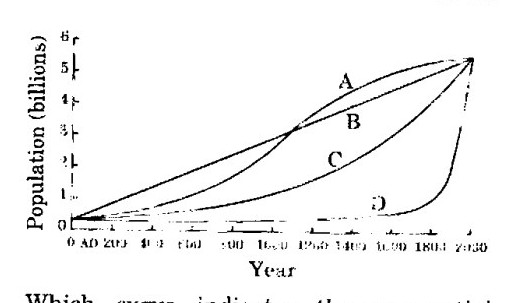
The following figure has four curves namely A, B, C and D. Study the figure and answer the item that follows. Which curve indicates the exponential growth ?
UPSC published no Prelims answer keys before 2012.
Source: UPSC, Civil Services (Preliminary) Examination 2011, General Studies Paper II (CSAT), Series A. The paper on upsc.gov.in.