UPSC Prelims 2018 · CSAT
Question 71: Data Interpretation
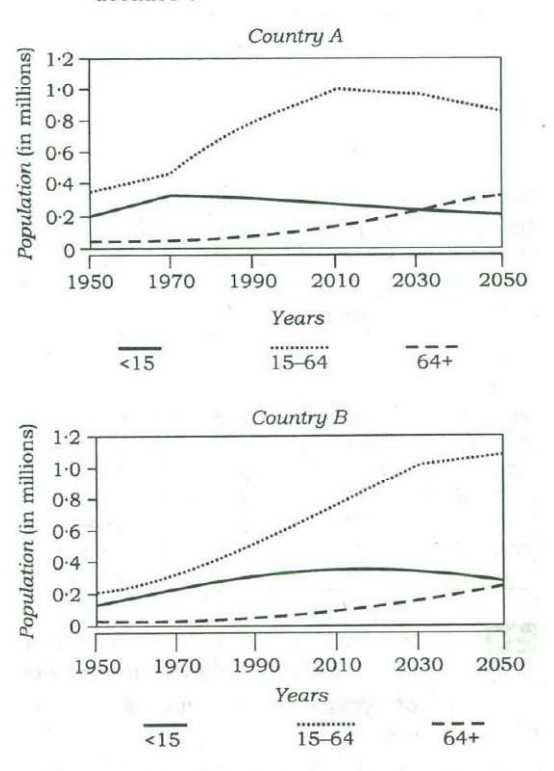
Consider the following graphs. The curves in the graphs indicate different age groups in the populations of two countries A and B over a period of few decades : With reference to the above graphs, which of the following are the most logical and rational inferences that can be made?
- 1.Over the last two and a half decades, the dependency ratio for country B has decreased.
- 2.By the end of next two and a half decades, the dependency ratio of country A will be much less than that of country B.
- 3.In the next two decades, the work-force relative to its total population will increase in country B as compared to country A.
Select the correct answer using the code given below.
AnswerUPSC’s answer is (c).
Dependency ratio = (under 15 + over 64) ÷ working-age (15 to 64). Country B: about (0.32 + 0.05) ÷ 0.52 = 0.71 in 1990 and (0.36 + 0.10) ÷ 0.80 = 0.58 in 2010, so it falls (statement 1). By 2030 the ratios of A and B are about equal, 0.49 and 0.50, so A's is not much lower (statement 2). Workforce share rises for B from about 63% to 66% between 2010 and 2030 but falls for A from about 70% to 67% (statement 3). Readings are approximate.
- 1. B's dependency ratio drops from about 0.71 to about 0.58.
- 2. A's and B's ratios are about equal by 2030, not much lower for A.
- 3. B's workforce share rises while A's falls.
How you could have got this
- If you were sure statement 2 is not correct, (a), (b) and (d) go: each of them includes 2.
What you needed to know: A's and B's ratios are about equal by 2030, not much lower for A.
Only (c) is left. You didn’t need statements 1 or 3.
Which options go is worked out from UPSC’s key and the options, not by a model.
Why each option is right or wrong
- (a) Statement 2 fails: the two ratios are about equal by 2030.
- (b) Statement 2 fails, so this pair is wrong.
- (c) Correct: B's ratio falls and its workforce share gains on A's.
- (d) Statement 2 fails, so not all three hold.
Answer: UPSC’s key. Explanation: written by UPSC Grade, not by UPSC.
Source: UPSC, Civil Services (Preliminary) Examination 2018, General Studies Paper II (CSAT), Series A. The paper on upsc.gov.in.