UPSC Prelims 2018 · CSAT
Question 61: Data Interpretation
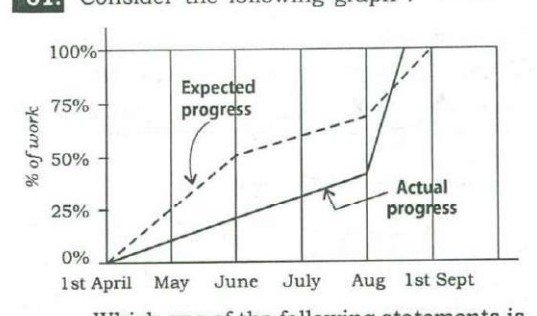
Consider the following graph :
Which one of the following statements is not correct with reference to the graph given above?
AnswerUPSC’s answer is (d).
Read the two lines. On 1 June the actual line is at about 20% and the expected line at about 50%, so statement (a) is true. The actual line is steepest in August, so (b) is true. It reaches 100% just before the expected line does, so (c) is true. Near the end, though, the actual line climbs above the expected line before the two finish, so at some time actual progress was more than expected. That makes (d) the incorrect statement, which the question asks for.
Why each option is right or wrong
- (a) True: about 20% actual against about 50% expected on 1 June.
- (b) True: the actual line is steepest in August.
- (c) True: the actual line reaches 100% before the expected one.
- (d) Correct choice: the actual line rises above the expected one near the end.
Answer: UPSC’s key. Explanation: written by UPSC Grade, not by UPSC.
Source: UPSC, Civil Services (Preliminary) Examination 2018, General Studies Paper II (CSAT), Series A. The paper on upsc.gov.in.