UPSC Prelims 2018 · CSAT
Question 5: Basic Numeracy
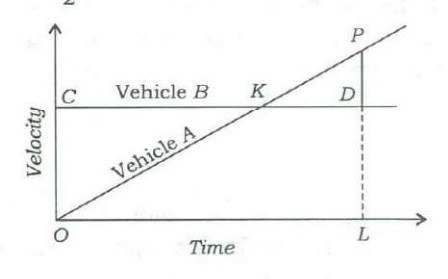
The figure drawn below gives the velocity graphs of two vehicles A and B. The straight line OKP represents the velocity of vehicle A at any instant, whereas the horizontal straight line CKD represents the velocity of vehicle B at any instant. In the figure, D is the point where perpendicular from P meets the horizontal line CKD such that PD = 1/2 LD :
What is the ratio between the distances covered by vehicles A and B in the time interval OL?
AnswerUPSC’s answer is (c).
On a velocity-time graph, distance covered is the area under the line. Vehicle B moves at constant velocity LD, so its distance in time OL is the rectangle OL × LD. Vehicle A's line runs from the origin to P, so its distance is the triangle OLP, area ½ × OL × LP. Since PD is half of LD, LP = LD + ½LD = 1.5 LD. So A covers ½ × OL × 1.5 LD = 0.75 × OL × LD. Ratio A : B = 0.75 : 1 = 3 : 4.
Why each option is right or wrong
- (a) 1 : 2 would need A's final velocity to equal B's velocity.
- (b) 2 : 3 does not follow; A's triangle is 0.75 of B's rectangle.
- (c) Correct: triangle area 0.75 × OL × LD against rectangle OL × LD.
- (d) 1 : 1 would need A's final velocity to be twice B's.
Answer: UPSC’s key. Explanation: written by UPSC Grade, not by UPSC.
Source: UPSC, Civil Services (Preliminary) Examination 2018, General Studies Paper II (CSAT), Series A. The paper on upsc.gov.in.