UPSC Prelims 2015 · CSAT
Question 52: Data Interpretation
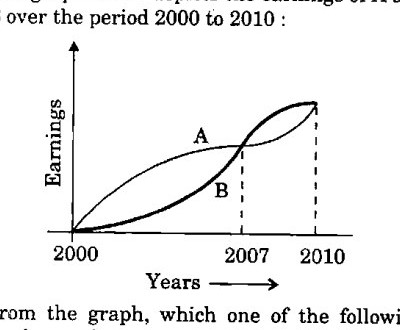
The graph below depicts the earnings of A and B over the period 2000 to 2010 :
From the graph, which one of the following can be concluded ?
AnswerUPSC’s answer is (a).
Compare the curves over the whole period. A is above B from 2000 to 2007, a gap that is wide and lasts seven years. They meet in 2007. After that, any lead B gets is smaller and lasts only three years, and they meet again in 2010. The total area under A is therefore larger, so on average A earned more than B. The curves are equal only at the meeting points, not throughout.
Why each option is right or wrong
- (a) Right: A leads for the longer stretch and by a bigger margin, so its average is higher.
- (b) Wrong: B leads only briefly after 2007 and by less.
- (c) Wrong: they are equal only at the points where the curves meet.
- (d) Wrong: A was above B for most of the period.
Answer: UPSC’s key. Explanation: written by UPSC Grade, not by UPSC.
Source: UPSC, Civil Services (Preliminary) Examination 2015, General Studies Paper II (CSAT), Series A. The paper on upsc.gov.in.