UPSC Prelims 2013 · CSAT
Question 52: Data Interpretation
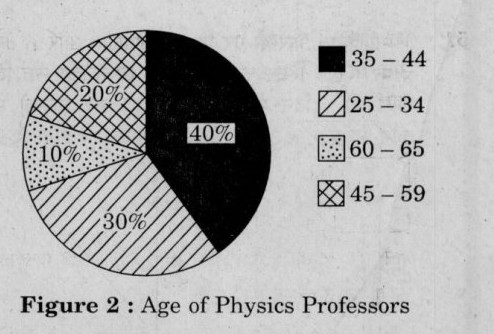
How many Physics professors belong to the age group 35 – 44 ?
AnswerUPSC’s answer is (b).
Figure 2 gives the age shares of Physics professors, and 40 per cent of them are aged 35 to 44. Figure 1 shows 32 male and 8 female Physics professors, which makes 40 in total. So the number in the 35 to 44 group is 40 per cent of 40, which is 16. Always read the total from the bar chart before applying a percentage from the pie chart.
How you could have got this
No shortcut here: in a “how many” question, ruling out options doesn’t help. Every statement has to be judged.
Which options go is worked out from UPSC’s key and the options, not by a model.
Why each option is right or wrong
- (a) Wrong. 18 would be 45 per cent of 40.
- (b) Right. 40 per cent of 40 is 16.
- (c) Wrong. 14 would be 35 per cent of 40.
- (d) Wrong. 12 is 30 per cent, the 25 to 34 group.
Answer: UPSC’s key. Explanation: written by UPSC Grade, not by UPSC.
Source: UPSC, Civil Services (Preliminary) Examination 2013, General Studies Paper II (CSAT), Series A. The paper on upsc.gov.in.